


plotsOfDifferences: Visualize Mean and Median Differences in Data
★ ★ ★ ★ ★ | 1 reviews | 7 users
About the app
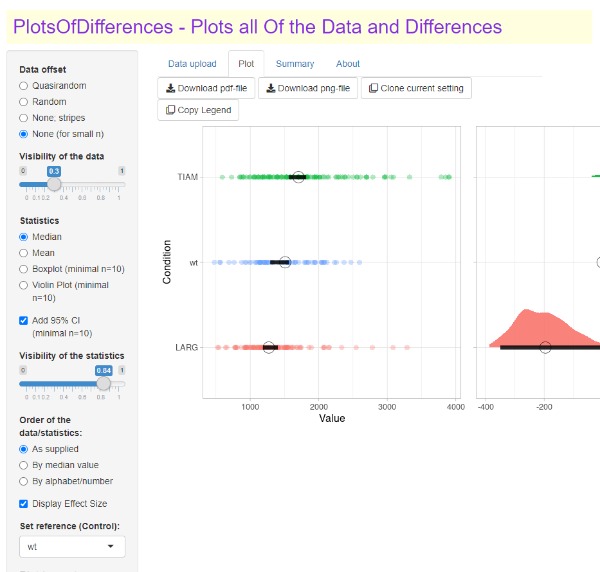
plotsOfDifferences is an application designed to create visual representations of the differences between the mean or median of selected conditions and a reference condition. This approach utilizes effect size measurements, offering advantages over traditional null-hypothesis tests for sample comparisons. By plotting both raw data and statistics, PlotsOfDifferences enhances transparency and interpretation. Users can customize the presentation of data and statistics through transparency adjustments. Additionally, the app quantifies differences in central tendency, requiring the definition of a reference condition, which is user-modifiable. Bootstrap sampling generates 95% confidence intervals for differences, providing a comprehensive comparison tool for experimental conditions.
Data Safety
Safety starts with understanding how developers collect and share your data. Data privacy and security practices may vary based on your use, region, and age. The developer provided this information and may update it over time.
Rate this App
App Updates and Comments
No application notes or reviews.
Post response or reviewsOther Similar Apps
About ShinyAppStore
ShinyAppStore is the leading platform for showcasing and utilizing a wide range of Shiny applications developed with the shiny R package. We will be expanding access to allow shiny apps built with Python as well. Users can submit and explore applications across various categories, add verified apps to their personal library, and enjoy easy access. The platform features well-designed apps with detailed descriptions and evaluations by users. All applications on ShinyAppStore are user-owned and open source, with the source code readily available for download on our GitHub page.
More "about" details