


visTrajectory: Visualize latent trajectories and their uncertainties
★ ☆ ☆ ☆ ☆ | 6 users
About the app
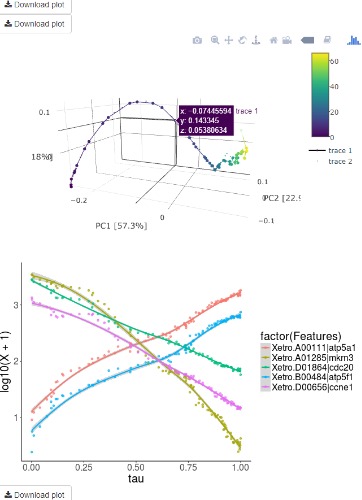
visTrajectory is a Shiny App for visualizing latent trajectories and their uncertainties in multivariate and high-dimensional datasets. It uses the Bayesian Unidimensional Scaling (BUDS) technique which extracts dominant sources of variation in high dimensional datasets and produces their visual data summaries, facilitating the exploration of a hidden continuum. The method maps multivariate data points to latent one-dimensional coordinates along their underlying trajectory, and provides estimated uncertainty bounds. By statistically modeling dissimilarities and applying a DiSTATIS registration method to their posterior samples, we are able to incorporate visualizations of uncertainties in the estimated data trajectory across different regions using confidence contours for individual data points. Original publication: Nguyen and Holmes. BMC Bioinformatics volume 18, Article number: 394 (2017)
Data Safety
Safety starts with understanding how developers collect and share your data. Data privacy and security practices may vary based on your use, region, and age. The developer provided this information and may update it over time.
Rate this App
App Updates and Comments
No application notes or reviews.
Post response or reviewsOther Similar Apps
About ShinyAppStore
ShinyAppStore is the leading platform for showcasing and utilizing a wide range of Shiny applications developed with the shiny R package. We will be expanding access to allow shiny apps built with Python as well. Users can submit and explore applications across various categories, add verified apps to their personal library, and enjoy easy access. The platform features well-designed apps with detailed descriptions and evaluations by users. All applications on ShinyAppStore are user-owned and open source, with the source code readily available for download on our GitHub page.
More "about" details