aPCoA: Easy Covariate Adjusted Principal Coordinates Analysis
★ ★ ★ ★ ☆ | 1 reviews | 16 users
About the app
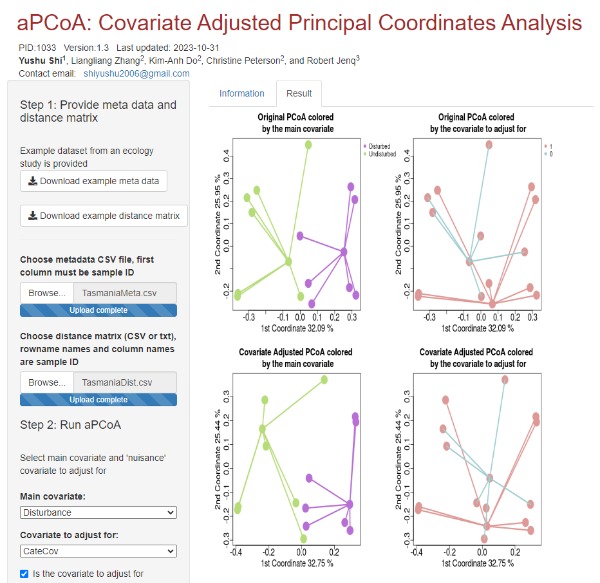
aPCoA app introduces an innovative visualization technique for adjusted Principal Coordinates Analysis (PCoA), enabling the incorporation of covariate adjustments into the PCoA projection. Principal Coordinates Analysis, often referred to as classic or metric multidimensional scaling, provides a means to visualize sample variation and potentially identify clusters by reducing data dimensions. Prior to the development of aPCoA, the challenge with PCoA was that confounding covariates could overshadow the primary covariate's effect. For instance, in a study exploring the microbiome's response to diet, site-related clustering might dominate the visual representation if patients were recruited from multiple locations. While several methods have been proposed to account for covariates in Principal Component Analysis, there were no existing solutions for adjusting covariates in PCoA. Original article: Shi et al. Bioinformatics, Volume 36, Issue 13, July 2020, Pages 4099–4101
Data Safety
Safety starts with understanding how developers collect and share your data. Data privacy and security practices may vary based on your use, region, and age. The developer provided this information and may update it over time.
Rate this App
App Updates and Comments
No application notes or reviews.
Post response or reviewsOther Similar Apps
About ShinyAppStore
ShinyAppStore is the leading platform for showcasing and utilizing a wide range of Shiny applications developed with the shiny R package. We will be expanding access to allow shiny apps built with Python as well. Users can submit and explore applications across various categories, add verified apps to their personal library, and enjoy easy access. The platform features well-designed apps with detailed descriptions and evaluations by users. All applications on ShinyAppStore are user-owned and open source, with the source code readily available for download on our GitHub page.
More "about" details


