


shinyAIM: Interactive Visualization of Manhattan Plots
★ ☆ ☆ ☆ ☆ | 2 users
About the app
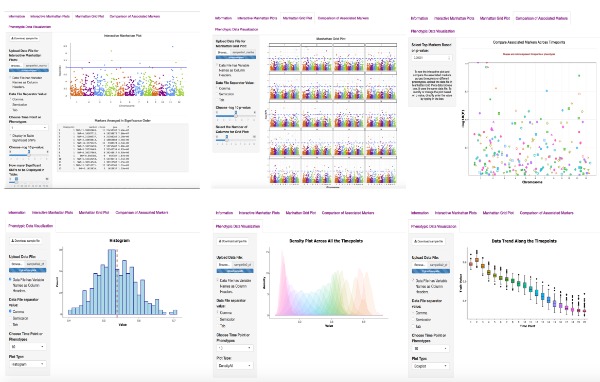
ShinyAIM is a Shiny-based application designed for interactive visualization of Manhattan plots in longitudinal genome-wide association studies. It allows users to dynamically explore and interpret results over multiple time points. Key features of ShinyAIM include interactive Manhattan plots for individual time points, a grid plot to view Manhattan plots across all time points simultaneously, dynamic scatter plots for selected markers, and interactive visualization of phenotypic data to capture phenotype variation and trends. Users can select a target time point, and an interactive Manhattan plot is generated, providing detailed marker information and p-values. Users can adjust the significance level, display a list of markers, and control the number of markers shown in the table below the plot. This tool offers valuable insights into longitudinal GWAS results. Original article: Plant Direct . 2018 Oct 24;2(10):e00091. doi: 10.1002/pld3.91. eCollection 2018 Oct.
Data Safety
Safety starts with understanding how developers collect and share your data. Data privacy and security practices may vary based on your use, region, and age. The developer provided this information and may update it over time.
Rate this App
App Updates and Comments
No application notes or reviews.
Post response or reviewsOther Similar Apps
About ShinyAppStore
ShinyAppStore is the leading platform for showcasing and utilizing a wide range of Shiny applications developed with the shiny R package. We will be expanding access to allow shiny apps built with Python as well. Users can submit and explore applications across various categories, add verified apps to their personal library, and enjoy easy access. The platform features well-designed apps with detailed descriptions and evaluations by users. All applications on ShinyAppStore are user-owned and open source, with the source code readily available for download on our GitHub page.
More "about" details