


GENAVi: Streamline gene expression normalization and analysis
★ ☆ ☆ ☆ ☆ | 5 users
About the app
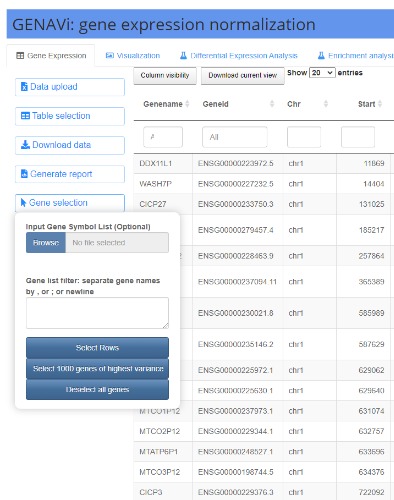
GENAVi is a Shiny web app that provides four types of data normalization, four types of data visualization, differential expression analysis (DEA) and gene set enrichment analysis using count level RNA-Seq data. GENAVi can be used to analyze the provided RNA-Seq datasets or users can upload their own mouse or human RNA-seq data for normalization and analysis. The application currently provides a panel of cell lines that are commonly used as models for ovarian and breast cancer in various research programs. The second feature of GENAVi is the visualization of gene expression across samples. This is accomplished in four separate outputs within the “Visualization” tab. The first two plots can be viewed under the “Expression plots” subtab. When the user wants to view the expression of a single gene across all samples and selects this gene in the data table, a bar plot is generated in the plotting subtab.
Data Safety
Safety starts with understanding how developers collect and share your data. Data privacy and security practices may vary based on your use, region, and age. The developer provided this information and may update it over time.
Rate this App
App Updates and Comments
No application notes or reviews.
Post response or reviewsOther Similar Apps
About ShinyAppStore
ShinyAppStore is the leading platform for showcasing and utilizing a wide range of Shiny applications developed with the shiny R package. We will be expanding access to allow shiny apps built with Python as well. Users can submit and explore applications across various categories, add verified apps to their personal library, and enjoy easy access. The platform features well-designed apps with detailed descriptions and evaluations by users. All applications on ShinyAppStore are user-owned and open source, with the source code readily available for download on our GitHub page.
More "about" details