CYANUS: Systematic CyTOF Data Analysis
★ ★ ★ ★ ★ | 1 reviews | 7 users
About the app
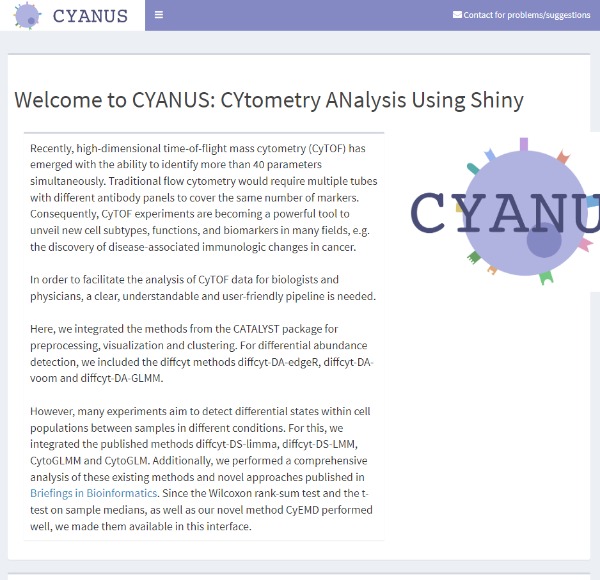
CYANUS is an application designed for the systematic evaluation of various approaches for Differential Expression Analysis on both Real and Simulated CyTOF (time-of-flight mass cytometry) Data. The application, including the Shiny App CYANUS, offers a user-friendly interface and provides several built-in datasets, such as PBMC, CytoGLMM, and semi-simulated COVID-19 datasets. These datasets, including their down sampled versions, can be generated in DataGeneration. Notably, CYANUS supports user-uploaded datasets, enhancing its flexibility for diverse analyses. The application is particularly relevant in the context of high-dimensional CyTOF, a technology capable of identifying parameters simultaneously. In contrast to traditional flow cytometry, CyTOF simplifies the process by enabling the simultaneous measurement of multiple markers, making it a potent tool for unveiling new cell subtypes, functions, and biomarkers. Article: Arend et al. Brief Bioinform . 2022 Jan 17;23(1):bbab471.
Data Safety
Safety starts with understanding how developers collect and share your data. Data privacy and security practices may vary based on your use, region, and age. The developer provided this information and may update it over time.
Rate this App
App Updates and Comments
No application notes or reviews.
Post response or reviewsOther Similar Apps
About ShinyAppStore
ShinyAppStore is the leading platform for showcasing and utilizing a wide range of Shiny applications developed with the shiny R package. We will be expanding access to allow shiny apps built with Python as well. Users can submit and explore applications across various categories, add verified apps to their personal library, and enjoy easy access. The platform features well-designed apps with detailed descriptions and evaluations by users. All applications on ShinyAppStore are user-owned and open source, with the source code readily available for download on our GitHub page.
More "about" details


