


ggPlotteR: Encode Data Visualizations Line by Line
★ ★ ★ ★ ☆ | 2 reviews | 10 users
About the app
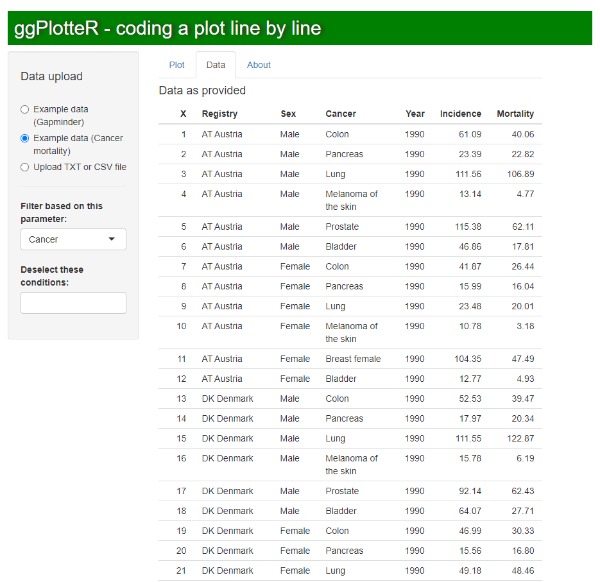
ggPlotteR is an educational application designed to demonstrate the step-by-step and line-by-line use of the ggplot2 package for data visualization in R. It allows users to generate plots and retrieve the R-code for recreating them. The app's code is partially based on ggplotGUI by Gert Stulp, and it incorporates the concept of line-by-line encoding from Evangeline Reynolds. ggPlotteR offers an intuitive interface and the option to download the generated graph in PNG format. The application includes a built-in dataset for setting up plot inputs, eliminating the need for users to upload their datasets. However, it also allows users to upload their datasets if desired, offering flexibility in data handling.
Data Safety
Safety starts with understanding how developers collect and share your data. Data privacy and security practices may vary based on your use, region, and age. The developer provided this information and may update it over time.
Rate this App
App Updates and Comments
No application notes or reviews.
Post response or reviewsOther Similar Apps
About ShinyAppStore
ShinyAppStore is the leading platform for showcasing and utilizing a wide range of Shiny applications developed with the shiny R package. We will be expanding access to allow shiny apps built with Python as well. Users can submit and explore applications across various categories, add verified apps to their personal library, and enjoy easy access. The platform features well-designed apps with detailed descriptions and evaluations by users. All applications on ShinyAppStore are user-owned and open source, with the source code readily available for download on our GitHub page.
More "about" details