


ggMarginal: Add marginal plots to ggplot2 scatterplots
★ ☆ ☆ ☆ ☆ | 7 users
About the app
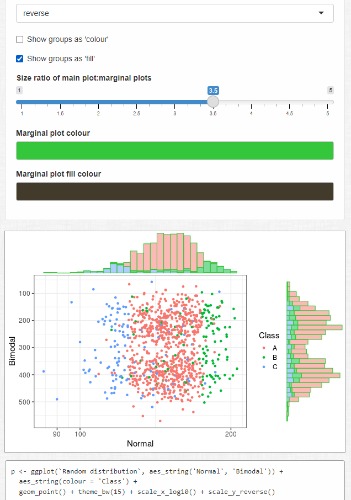
This is a demo of the ggMarginal function, which provides is an easy drop-in solution for adding marginal density plots/histograms/boxplots to a ggplot2 scatterplot. ggMarginal is the flagship function of the popular {ggExtra} package, which is a collection of functions and layers to enhance ggplot2. Within an R script, the easiest way to use ggMarginal is by simply passing it a ggplot2 scatter plot object, and then watch how the marginal plots are added. Marginal plots, also known as marginal distributions or marginal histograms, are graphical representations that provide additional insights into the univariate distribution of variables in a dataset. They are typically displayed alongside a scatter plot or a main plot.
Data Safety
Safety starts with understanding how developers collect and share your data. Data privacy and security practices may vary based on your use, region, and age. The developer provided this information and may update it over time.
Rate this App
App Updates and Comments
No application notes or reviews.
Post response or reviewsOther Similar Apps
About ShinyAppStore
ShinyAppStore is the leading platform for showcasing and utilizing a wide range of Shiny applications developed with the shiny R package. We will be expanding access to allow shiny apps built with Python as well. Users can submit and explore applications across various categories, add verified apps to their personal library, and enjoy easy access. The platform features well-designed apps with detailed descriptions and evaluations by users. All applications on ShinyAppStore are user-owned and open source, with the source code readily available for download on our GitHub page.
More "about" details